Introduction to Statistics (Mean, Median and Mode)
expand_moreIntroduction to Statistics
Statistics involves the collection, organization, analysis, interpretation, and presentation of a data set. It is used to help governments and companies make informed decision, and we hope after finishing the statistics section, you will start using stats also when making important decisions, especially.
Was this lesson helpful?
thumb_up thumb_downWhat is a mean, median and mode
Mean
- Mean is the same as the average and is a useful property for understanding data sets.
- It is the value if all data values were made the same.
- Calculated by adding up all the values and then dividing the total by how many numbers were added.
- The equation of the mean is therefore, x = ∑/n
∑ representing the sum all date set values
n, representing total number of the values.
Median
- Median is the middle number in a data set when the numbers are in order.
- In a data set with an odd number of members, the middle number is the median.
- In a data set with an even number of members, the mean of the two middle numbers is the median.
Mode
- Mode is the value that occurs most often in a data set.
- It is the number that is repeated the most, not how many times it was repeated.
- A data set can have no mode, one mode, or more than one mode.
Real-World Example
- Heights of ten male students in a class were measure in centimeters (cm) as
175, 166, 181, 164, 181, 171, 167, 182, 172, 176.
Find the mean height of the above data set.
First step, we recommend arranging the data in an ascending order
Hence, the data set will now look as follow: 164, 166, 167, 171, 172, 175, 176, 181, 181, 182.
mean = ∑/n
mean = (164 + 166 + 167 + 171 + 172 + 175 + 176 + 181 + 181 + 182)/10
mean = 1735/10
mean = 173.5
Therefore, the average or mean height of these 10 students is 173.5Find the median height of the above data set.
There is a very important factor you need to consider when working with the median, which is:
Is the total number of data set even or odd. If the total is even, the median is the mean of the two middle numbers in the data set, e.g,:
The median of the data set above is the sum of the middle values because the total number of data is 10, which is an even number divide by 2.
Median = (∑ of the 5th and 6th value)/2
Median = (172 + 175)/2
Median = 187
Additionally, if the data set total is odd, e.g., 164, 166, 167, 171, 172, 175, 176, 181, 181
In this scenario, the median is simply 172, because 172 is the exact middle number of the data set
Find the median height of the above data set.
The mode of this data is 181. Because it a value found more than once in the data set above
Population vs Sample
expand_moreThe difference between population and sample
An arithmetic progression or arithmetic sequence is a sequence of numbers such that the difference between the consecutive terms is constant. And it is the most basic type of all sequences.
Was this lesson helpful?
thumb_up thumb_downVariance and Standard deviation
expand_moreVariance and Standard deviation
Was this lesson helpful?
thumb_up thumb_downVariance and Standard deviation
- Tn = an2 + bn + c
- -145; -122; -101; -82;...
- First, you find the first differences
-122 - (-145) = -122 + 145 = 23
-101 - (-122) = -101 + 122 = 21
-82 - (-101) = -82 + 101 = 19. -
21 - 23 = -2
19 - 21 = -2 - Find a by 2a = the 2nd difference
2a = -2
2a/2 = -2/2
Therefore, a = -1 -
3a + b = 23
3(-1) + b = 23
-3 + b = 23
b = 23 + 3
b = 26 -
a + b + c = -145
-1 + 26 + c = -144
25 + c = -145
c = -170 -
Tn=-1n2+26n-170
Finding the formula of a quadratic sequence:
Then, find the difference of the first differences:
Find b by 3a + b = the first value of the first differences
Last but not least, find c by a + b + c = the first value of the sequence
Therefore, the quadratic equation for this sequence is:
Systolic blood pressure of five patients was collected:
1, 0, 0, 0, 0.
What is the mean of the systolic blood pressures above?
Roundoff your answer into two decimal places.
Chances: 2
You get two chances for this question.
1, 0, 0, 0, 0: What is the median of the data set?
✔️❌Chances: 2
You get two chances for this question.
1, 0, 0, 0, 0: Does the data set have mode?
Yes/No
Chances: 1
You get one chance for this question.
1, 0, 0, 0, 0: What is the mode?
✔️❌Chances: 1
You get one chances for this question.
1, 0, 0, 0, 0: What is the standard deviation?
Your final answer into two decimal places.
Chances: 4
You get a maximum of four chances for this question.
- The first question you got 0/2
- The second question you got 0/2
- The third question you got 0/1
- The forth question you got 0/1
- The fifth question you got 0/4
Your total is therefore, 0/0.
Percentage
%
A Message here
Cumulative Frequency Distribution
expand_moreCumulative Frequency Distribution
Cumulative frequency distribution is a form of frequency distribution that represents the sum of a class and all classes below it.
Was this lesson helpful?
thumb_up thumb_downCumulative frequency distribution table
- Cumulative frequency distribution table contains three colums. Class Interval, frequency and cumulative frequency, respectively.
| Class Interval | Frequency | Cumulative Frequency |
| 0 ≤ x <10 | 0 | 0 |
| 10 ≤ x <20 | 0 | 0 |
| 20 ≤ x <30 | 2 | 2 |
| 30 ≤x < 40 | 4 | 6 |
| 40 ≤ x <50 | 6 | 12 |
| 50 ≤ x <60 | 5 | 17 |
| 60 ≤ x <70 | 7 | 24 |
| 70 ≤ x <80 | 3 | 27 |
| 80 ≤ x <90 | 2 | 29 |
| 90 ≤ x <100 | 1 | 30 |
Frequency
- Is the number of values falling within a given class interval.
e.g. The frequency of students that marks between 40 to 50, is 6 according to the graph.
Acumulative frequency
- Is the sum of all values falling under the overall lowest class interval to the current highest class interval.
e.g. The cumulative frequency of students with marks between 40 to 50, is 12 because 0 + 0 + 2 + 4 + 6 = 12.
Finding the estimated mean
- Find the mean of each class interval.
20 ≤ x <30 = 20 + 30 / 2 = 25
30 ≤ x <40 = 30 + 40 / 2 = 35
40 ≤ x <50 = 40 + 50 / 2 = 45
50 ≤ x <60 = 20 + 10 / 2 = 55
60 ≤ x <70 = 20 + 10 / 2 = 65
70 ≤ x <80 = 40 + 50 / 2 = 75
80 ≤ x <90 = 20 + 10 / 2 = 85
90 ≤ x <100 = 20 + 10 / 2 = 95
-
Second step
- Multiply each mean by the frequency of its class interval.
25 * 2 = 50
35 * 4 = 140
45 * 6 = 270
55 * 5 = 275
65 * 7 = 455
75 * 3 = 225
85 * 2 = 170
95 * 1 = 95
- Find the sum of all those products.
∑ = 50 + 140 + 270 + 275 + 455 + 225 + 170 + 95
∑ = 1680 -
Final step
The sum is then divided by the last cumulative frequency values, in this example that is 30. Mean = ∑/n
Mean = 1680/30
Mean = 56.
First step
Third step
Modal Class Determination
- The modal class, is the class interval with highest frequency.
- In the table above, that 60 ≤ x ≤70
Ogive (Cumulative Frequency Curve)
expand_moreOgive (Cumulative Frequency Curve)
An Ogive Chart is a curve of the cumulative frequency distribution or cumulative relative frequency distribution
Was this lesson helpful?
thumb_up thumb_downThe intelligence quotient (IQ) of Grade 10 class is summarized in the table below.
Complete the cumulative frequency column.
| Class Interval | Frequency | Cumulative Frequency |
| 90 ≤ x <100 | 0 | ✔️❌ |
| 100 ≤ x <100 | 0 | ✔️❌ |
| 110 ≤ x <120 | 0 | ✔️❌ |
| 120 ≤x < 130 | 0 | ✔️❌ |
| 130 ≤ x <140 | 0 | ✔️❌ |
| 140 ≤ x <150 | 0 | ✔️❌ |
Chances: 3
You get a maximum of three chances for this question.
What is the total number of students tested?
✔️❌Chances: 2
You get a maximum of two chances for this question.
Estimate the mean IQ score of this class of learners.
Roundoff your answer into two decimal places.
Chances: 3
You get a maximum of three chances for this question.
Write down the modal class of data
Chances: 2
You get a maximum of two chances for this question.
- The first question you got 0/3
- The second question you got 0/2
- The second question you got 0/3
- The second question you got 0/2
Your total is therefore, 0/6.
Percentage
%
A Message here
Range, Q1 - Q3, IQR and outliers
expand_morewhat is a range, Q1 - Q3, IQR and outliers
Was this lesson helpful?
thumb_up thumb_downIntroducing additional properties of data sets
- Min
- Max
- Range
- Quartiles
- Interquartile range
- Outliers
Minimum (Min)
Minimum is the lowest value of the data set.
- Given the data below, the minimum is 2.
2, 4, 6, 8, 10, 12, 14, 16.
Maximum (Max)
Maximum is the highest value of the data set.
- Given the data below, the maximum is 16.
2, 4, 6, 8, 10, 12, 14, 16.
Range
Is the difference between the highest value and the lowest value of the data set.
- 2, 4, 6, 8, 10, 12, 14, 16.
Range = max - min
Range = 16 - 2
Range = 14
Quartiles
quartiles are a type of quantiles which divide the number of data points into four parts, or quarters, of more-or-less equal size.

- There are three quartiles (Q1, Q2 and Q3)
Second quartile (Q2)
Q2 is the median of the data set.
So what is the second quartile of the data set below?
2, 4, 6, 8, 10, 12, 14, 16.
Median or Q2 = 10 + 8/2
Median or Q2 = 9
Thus second quartile of the data set above is 9.
First Quartile (Q1)
is the median of the values in the data set lower than the median of the whole data set.
Therefore Q1 of the data set below is the median of 2, 4, 6, 8.
2, 4, 6, 8, 9, 10, 12, 14, 16.
Q1 = 6 + 4/ 2
Q1 = 10/2
Q1 = 5
-
Quartile 3 (Q3)
Is the median of the values in the data set that are higher than the median of whole data set.
Hence, Q3 of the data set below is the median 10, 12, 14, 16.
2, 4, 6, 8, 9, 10, 12, 14, 16.
Q3 = 12 + 14/ 2
Q3 = 26/2
Q3 = 13
Interquartile range (IR)
-
IR is the difference between Q3 and Q1
IQR = Q3 - Q1
= 13 - 5
= 8
Outliers
-
Any values of the data set that are less than Q1 - 1.5 x IQR or greater than Q3 + 1.5 x IQR.
So, does our above data set have outliers?
Q1 - 1.5 x IQR
5 - 1.5 x 8
5 - 12
-7
Q3 + 1.5 x IQR
13 + 1.5 x 8
13 + 12
25
Therefore, the above data set have no outliers because all the values fall within -7 and 25.
The data below shows the number of cars sold by 10 sales people during the last financial year.
0 0 0 0 0 0 0 0 0 0
Find the range of the date set.
Chances: 2
You get a maximum of two chances for this question.
Find the Interquartile range (IRQ).
0 0 0 0 0 0 0 0 0 0
Chances: 3
You get a maximum of three chances for this question.
The sales numbers of one of the sales people was taken out, leaving us with the following data set.
0 0 0 0 0 0 0 0 0
What is the new Interquartile rate (IQR)?
Chances: 3
⚠️Roundoff into two decimal places.
You get a maximum of three chances for this question.
- The first question you got 0/2
- The second question you got 0/3
- The second question you got 0/3
Your total is therefore, 0/6.
Percentage
%
A Message here
Box and Whisker plot
expand_moreBox and Whisker plot
A box and whisker plot or diagram (otherwise known as a boxplot), is a graph summarising a set of data. The shape of the boxplot shows how the data is distributed and it also shows any outliers. It is a useful way to compare different sets of data as you can draw more than one boxplot per graph.
Was this lesson helpful?
thumb_up thumb_downBox and Whisker plot
- Sum: 6 + 2 = 8
- Difference: 6 - 2 = 4
- Product: 6 * 2 = 12
- Quotient/Ratio: 6 / 2 = 3
Histogram
expand_moreHistogram
A histogram is a graph used to represent the frequency distribution of a few data points of one variable.
Was this lesson helpful?
thumb_up thumb_downHistogram
- A histogram is a graph used to represent the frequency distribution of a few data points of one variable. It is used to summarize discrete or continuous data that are measured on an interval scale. It is often used to illustrate the major features of the distribution of the data in a convenient form. It is also useful when dealing with large data sets (greater than 100 observations).
- Bar graphs are useful to compare things between different groups or to track changes over time. However, when trying to measure change over time, bar graphs are best when the changes are larger.
- Line graphs are useful to track changes over short and long periods of time. When smaller changes exist, line graphs are better to use than bar graphs.
- Pie charts can be useful to show percentages of a whole, and represents percentages at a set point in time. Unlike bar graphs and line graphs, pie charts do not show changes over time.
Bar Graph
Line Graphs
Pie Graphs
Histogram part 2
expand_moreHistogram part2
Before drawing the histogram, you may need to construct class boundries.
Was this lesson helpful?
thumb_up thumb_downGraphing the histogram
expand_moreGraphing the histogram
Finally, constructing the histogram.
Was this lesson helpful?
thumb_up thumb_downThe skewness of the data set
expand_moreThe skewness of the data set
How can the mean, median, and mode give you an idea of your data distribution, before constructing the box and whisker plot or histogram.
Was this lesson helpful?
thumb_up thumb_down Solve the following:
0/0 + (0)/0
Chances: 2
You get a maximum of two chances for this question.
Solve the following:
0/0 + 0/0
Chances: 2
You get a maximum of two chances for this question.
Solve the following:
0/0 - 0/0
Chances: 2
You get a maximum of two chances for this question.
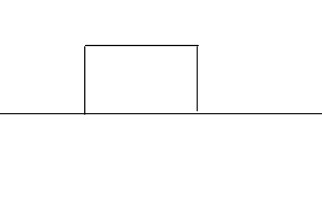
A a box with a mass of 0kg rests on a flat surface, find the normal acting on the box.

Chances: 2
You get a maximum of four chances for this question.
Find the static friction of the box, if its coefficient was 0.

Chances: 2
You get a maximum of two chances for this question.
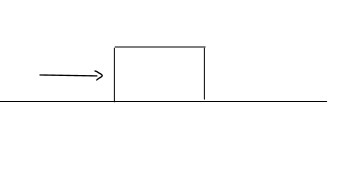
The box is now pushed horizontal to the right by a force of 0N is moving to the right with an acceleration of 0m/s2, what is the coefficient of the kinetic friction?

Chances: 3
You get a maximum of three chances for this question.
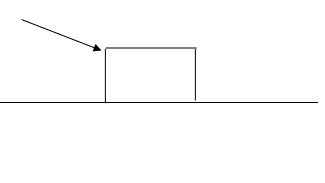
The box is now pushed at angle of 0° to the right by a force of 0N, Calculate the new normal force.

Chances: 3
You get a maximum of three chances for this question.
As the box continue to move, what is the acceleration of the box if kinetic friction coeffient was 0.

Chances: 3
You get a maximum of three chances for this question.